4 RCircos heatmap plot with gene expression data
Authors: Hongen Zhang Reviser: Tianze Cao
2025-06-05
Source:vignettes/04 Heatmap_Demo.Rmd
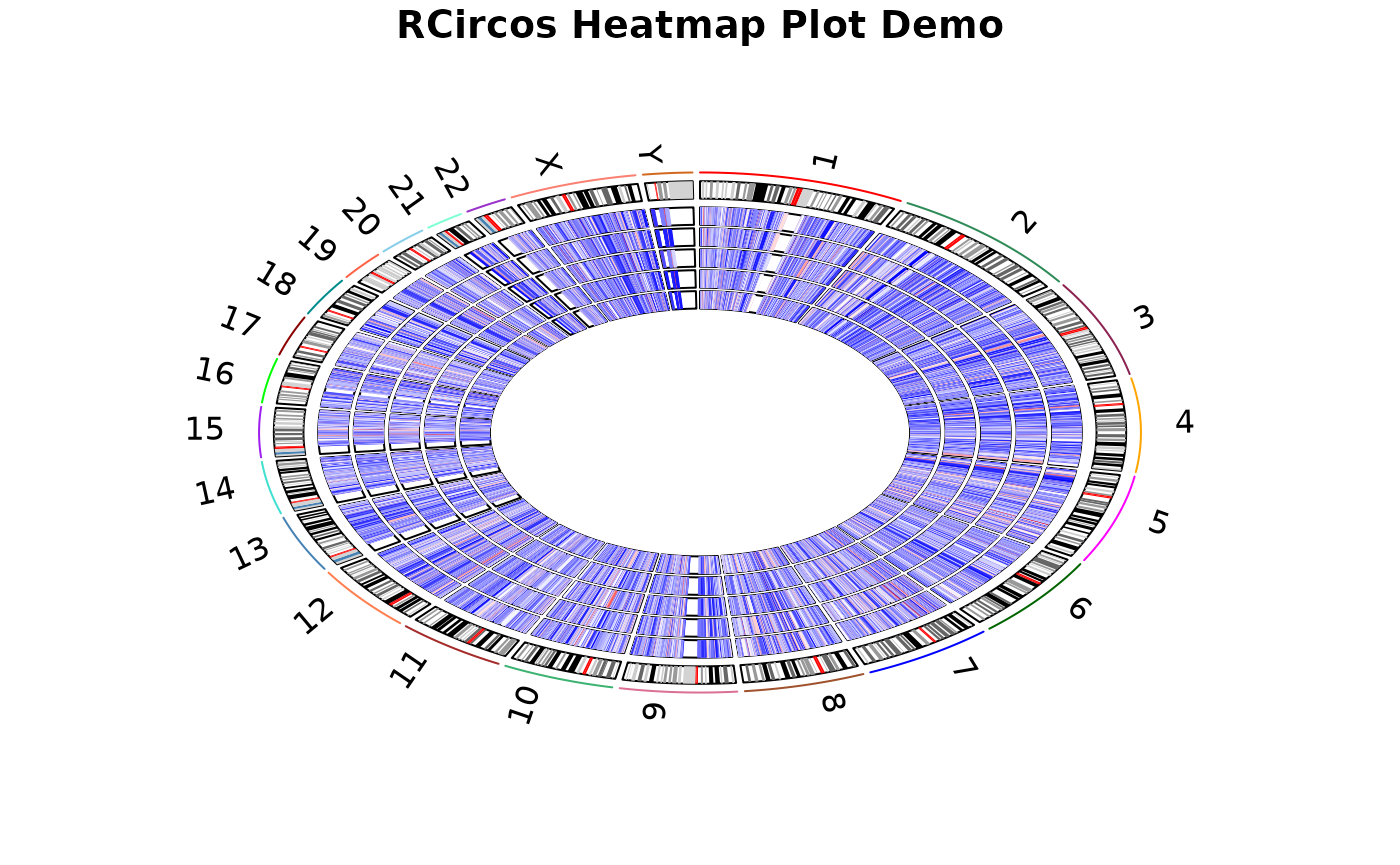
04 Heatmap_Demo.RmdThis demo draw chromosome ideogram with padding between chromosomes, highlights, chromosome names, and heatmap with gene expression data.
#   Load RCircos library

library(RCircos);

#   Load human cytoband data and gene expression data
data(RCircos.Heatmap.Data);
data(UCSC.HG19.Human.CytoBandIdeogram);
cyto.info <- UCSC.HG19.Human.CytoBandIdeogram;

#   Setup RCircos core components:

RCircos.Set.Core.Components(cyto.info, NULL, 5, 0);
##
## RCircos.Core.Components initialized.
## Type ?RCircos.Reset.Plot.Parameters to see how to modify the core components.
RCircos.Set.Plot.Area();

#   Draw chromosome ideogram

message("Draw chromosome ideogram ...\n");
## Draw chromosome ideogram ...
RCircos.Chromosome.Ideogram.Plot();
title("RCircos Heatmap Plot Demo");

#   Plot five tracks of heatmap

total.track <- 5;
for(a.track in 1:total.track)
{
    data.col <- a.track + 4;
    RCircos.Heatmap.Plot(RCircos.Heatmap.Data, data.col, a.track, "in");
}
# Close the graphic device