14 RCircos area plot
Authors: Hongen Zhang Reviser: Tianze Cao
2025-06-05
Source:vignettes/14 Area_Plot_Demo.Rmd
14 Area_Plot_Demo.RmdRCircos area plot demo
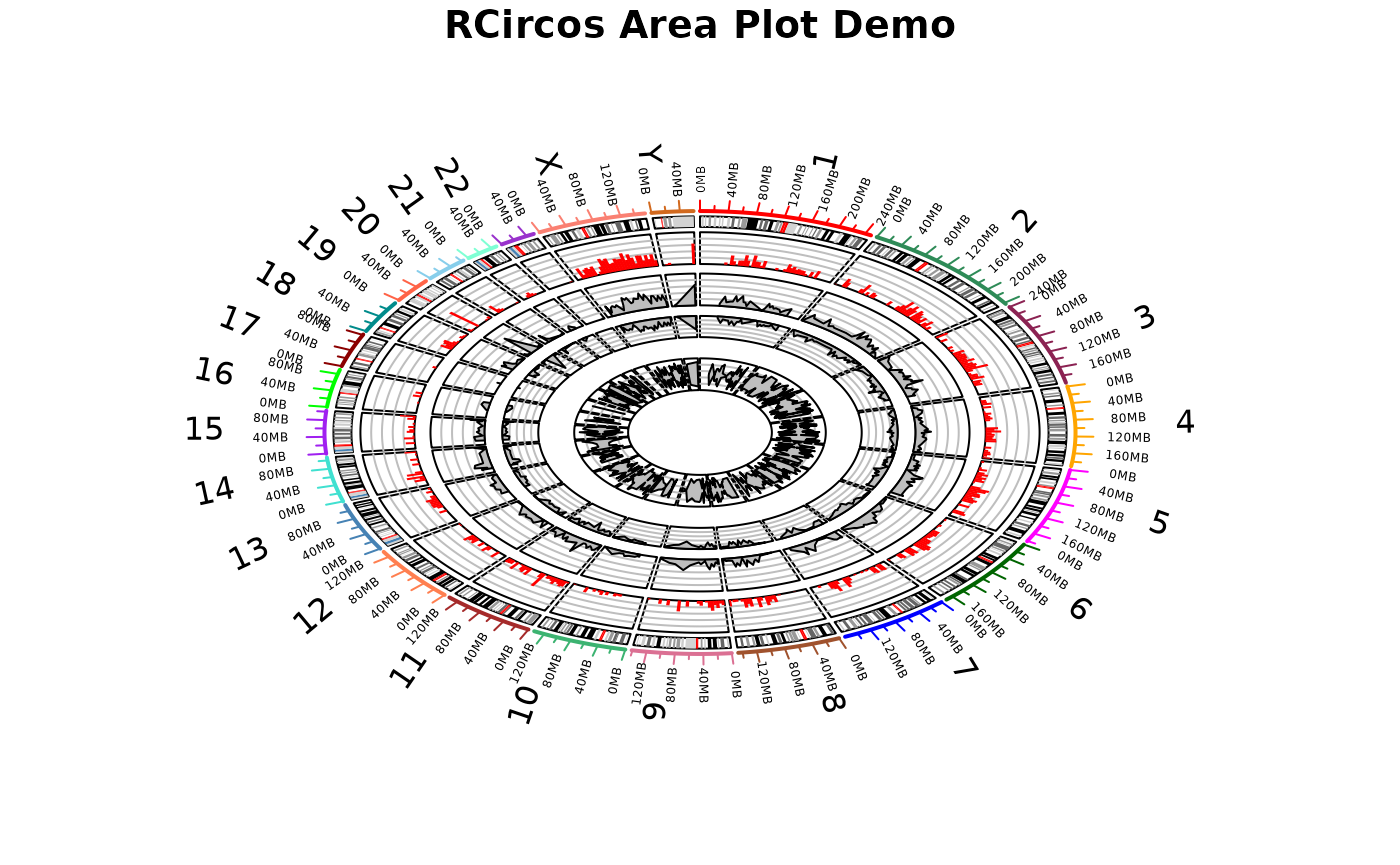
This demo draw chromosome ideogram with ticks, and use histogram data to make histogram plot and area plots (“mountain”, “curtain”, and “band”).
#   Load RCircos package

library(RCircos);

#   Load chromosome ideogram data and histogram plot data then
#   set up RCircos core components

data("UCSC.HG19.Human.CytoBandIdeogram");
data("RCircos.Histogram.Data");
RCircos.Set.Core.Components(UCSC.HG19.Human.CytoBandIdeogram,
        chr.exclude=NULL, tracks.inside=10, tracks.outside=5);
##
## RCircos.Core.Components initialized.
## Type ?RCircos.Reset.Plot.Parameters to see how to modify the core components.
RCircos.Set.Plot.Area();

#   plot chromosome ideogram and histogram

RCircos.Chromosome.Ideogram.Plot(20)
RCircos.Histogram.Plot(RCircos.Histogram.Data, data.col=4,
    inside.pos=1.59, outside.pos=1.89);

#   Area plot (mountain, curtain, and band)
area.data <- RCircos.Histogram.Data;
adj.value <- runif(nrow(area.data), 0, 0.4)
area.data["DataT"] <- 0.5 + adj.value
area.data["DataB"] <- 0.5 - adj.value

RCircos.Area.Plot(area.data, data.col=4, plot.type="mountain",
    inside.pos=1.2, outside.pos=1.5, is.sorted=FALSE);

RCircos.Area.Plot(area.data, data.col=4, plot.type="curtain",
    inside.pos=0.9, outside.pos=1.1, is.sorted=FALSE);

RCircos.Area.Plot(area.data, data.col=c(5,6), plot.type="band",
    inside.pos=0.4, outside.pos=0.7, is.sorted=FALSE);

title("RCircos Area Plot Demo");