12 RCircos chromosome tick plot
Authors: Hongen Zhang Reviser: Tianze Cao
2025-06-05
Source:vignettes/12 Chromosome_Tick_Demo.Rmd
12 Chromosome_Tick_Demo.RmdThis demo draw human chromosome ideogram with ticks. Since in most cases ticks are not necessary for data presentation, we add ticks to existing ideogram instead of plotting an ideogram with ticks.
Set 20 tracks inside of chromosome ideogram to get enough space for all chromosomes with ticks in 5MB interval
#   Load RCircos package

library(RCircos);

#   Load human cytoband data

data(UCSC.HG19.Human.CytoBandIdeogram);
hg19.cyto <- UCSC.HG19.Human.CytoBandIdeogram;

#   Set 10 tracks in outside of chromosome ideogram to get enough
#   space for all chromosomes ticks in 10 MB interval

RCircos.Set.Core.Components(cyto.info=hg19.cyto, chr.exclude=NULL,
        tracks.inside=10, tracks.outside=5);
##
## RCircos.Core.Components initialized.
## Type ?RCircos.Reset.Plot.Parameters to see how to modify the core components.
RCircos.Set.Plot.Area();
title("RCircos Tick Demo")

#   Draw chromosome ideogram with ticks in 10 mb interval
RCircos.Chromosome.Ideogram.Plot(tick.interval=10);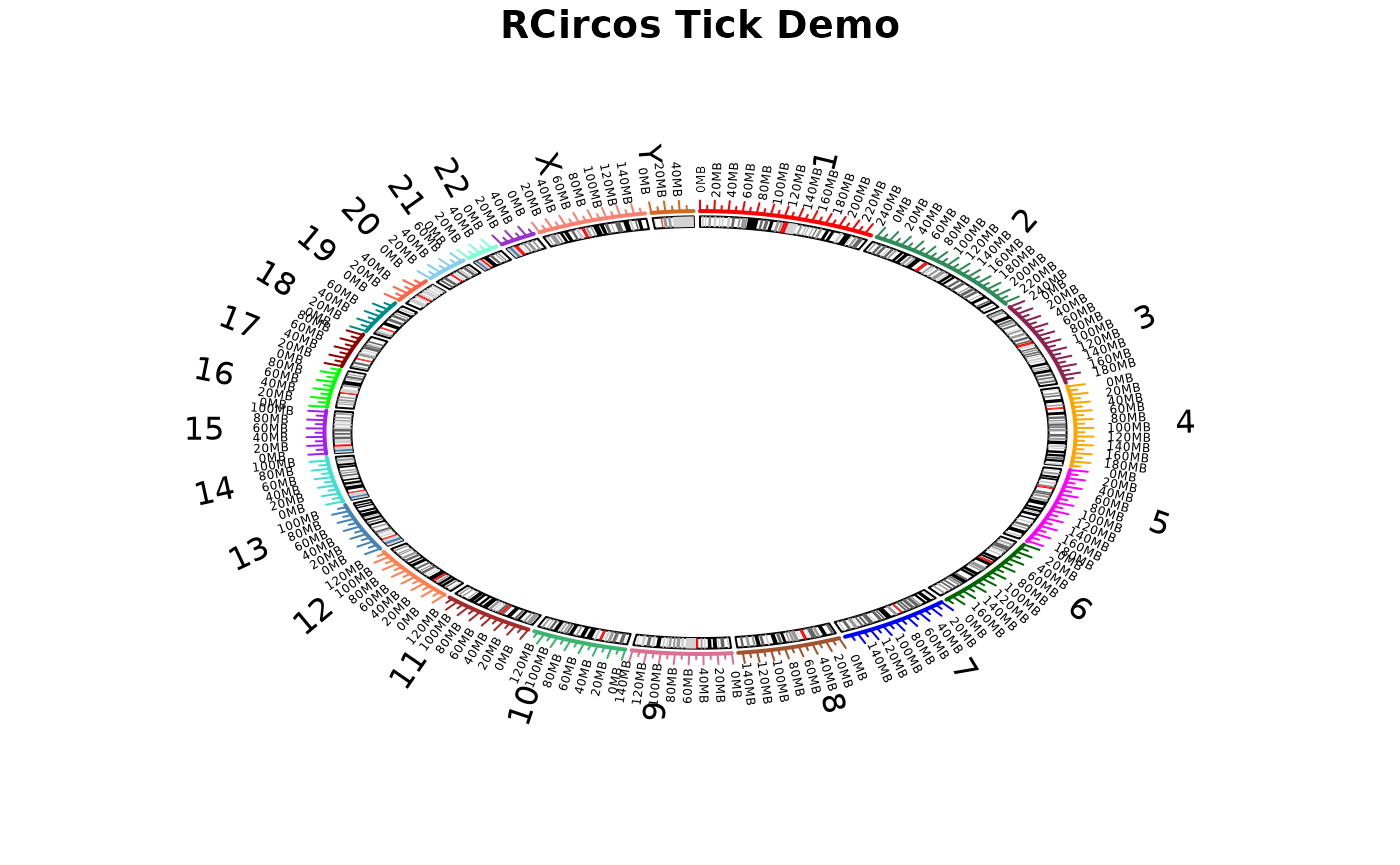
message("R Circos Tick Demo Done ...\n\n");## R Circos Tick Demo Done ...