5 RCircos histogram plot with CNV data
Authors: Hongen Zhang Reviser: Tianze Cao
2025-06-05
Source:vignettes/05 Histogram_Demo.Rmd
05 Histogram_Demo.RmdThis demo draw chromosome ideogram with padding between chromosomes, highlights, chromosome names, and histogram.
#  Load RCircos package and defined parameters
library(RCircos);


#  Load human cytoband data and gene expression data

data(RCircos.Histogram.Data);
data(UCSC.HG19.Human.CytoBandIdeogram);
cyto.info <- UCSC.HG19.Human.CytoBandIdeogram;

#  Setup RCircos core components:
RCircos.Set.Core.Components(cyto.info, NULL, 10, 0);
##
## RCircos.Core.Components initialized.
## Type ?RCircos.Reset.Plot.Parameters to see how to modify the core components.
#  Open the graphic device (here a pdf file)
RCircos.Set.Plot.Area();


#  Draw chromosome ideogram
message("Draw chromosome ideogram ...\n");
## Draw chromosome ideogram ...
RCircos.Chromosome.Ideogram.Plot();
title("RCircos Histogram Plot Demo");

#  Plot histogram Inside of chromosome ideogram
hist.data <- RCircos.Histogram.Data;
hist.colors <- rep("blue", nrow(hist.data))
rows <- which(hist.data$Data>0.4)
hist.colors[rows] <- "red";
hist.data["PlotColor"] <- hist.colors;

data.col <- 4;
track.num <- 1;
RCircos.Histogram.Plot(hist.data, data.col, track.num, "in");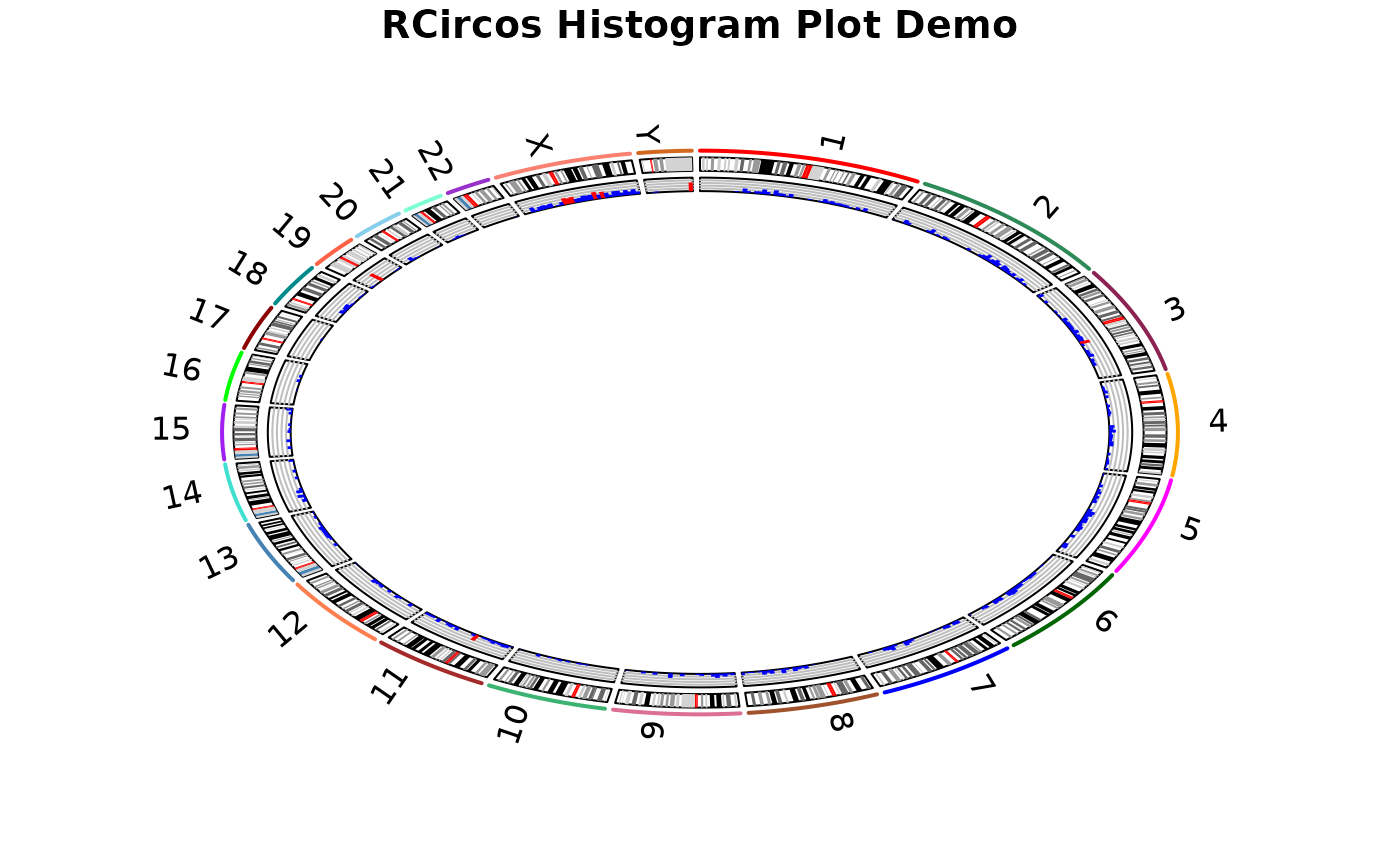
#  Close the graphic device and clear memory
message("RCircos Histogram Demo Done!");
## RCircos Histogram Demo Done!