13 RCircos tile plot
Authors: Hongen Zhang Reviser: Tianze Cao
2025-06-05
Source:vignettes/13 Tile_Plot_Demo.Rmd
13 Tile_Plot_Demo.RmdThis demo draw chromosome ideogram with padding between chromosomes, highlights, chromosome names, and tile plot.
#  Load RCircos library

library(RCircos);

#  Load human cytoband data and gene expression data

data(RCircos.Tile.Data);
data(UCSC.HG19.Human.CytoBandIdeogram);
cyto.info <- UCSC.HG19.Human.CytoBandIdeogram;

#  Setup RCircos core components:

RCircos.Set.Core.Components(cyto.info, NULL, 10, 0);
##
## RCircos.Core.Components initialized.
## Type ?RCircos.Reset.Plot.Parameters to see how to modify the core components.
RCircos.Set.Plot.Area();

#  Draw chromosome ideogram

RCircos.Chromosome.Ideogram.Plot();
title("RCircos Tile Plot Demo");

#  Tile plot. Note: tile plot data have chromosome
#  locations only and each data file is for one track

tile.data <- RCircos.Tile.Data;
tile.colors <- rainbow(nrow(tile.data));
tile.data["PlotColor"] <- tile.colors;

track.num <- 9;
RCircos.Tile.Plot(tile.data, track.num, "in");
## Tiles plot may use more than one track. Please select correct area for next track if necessary.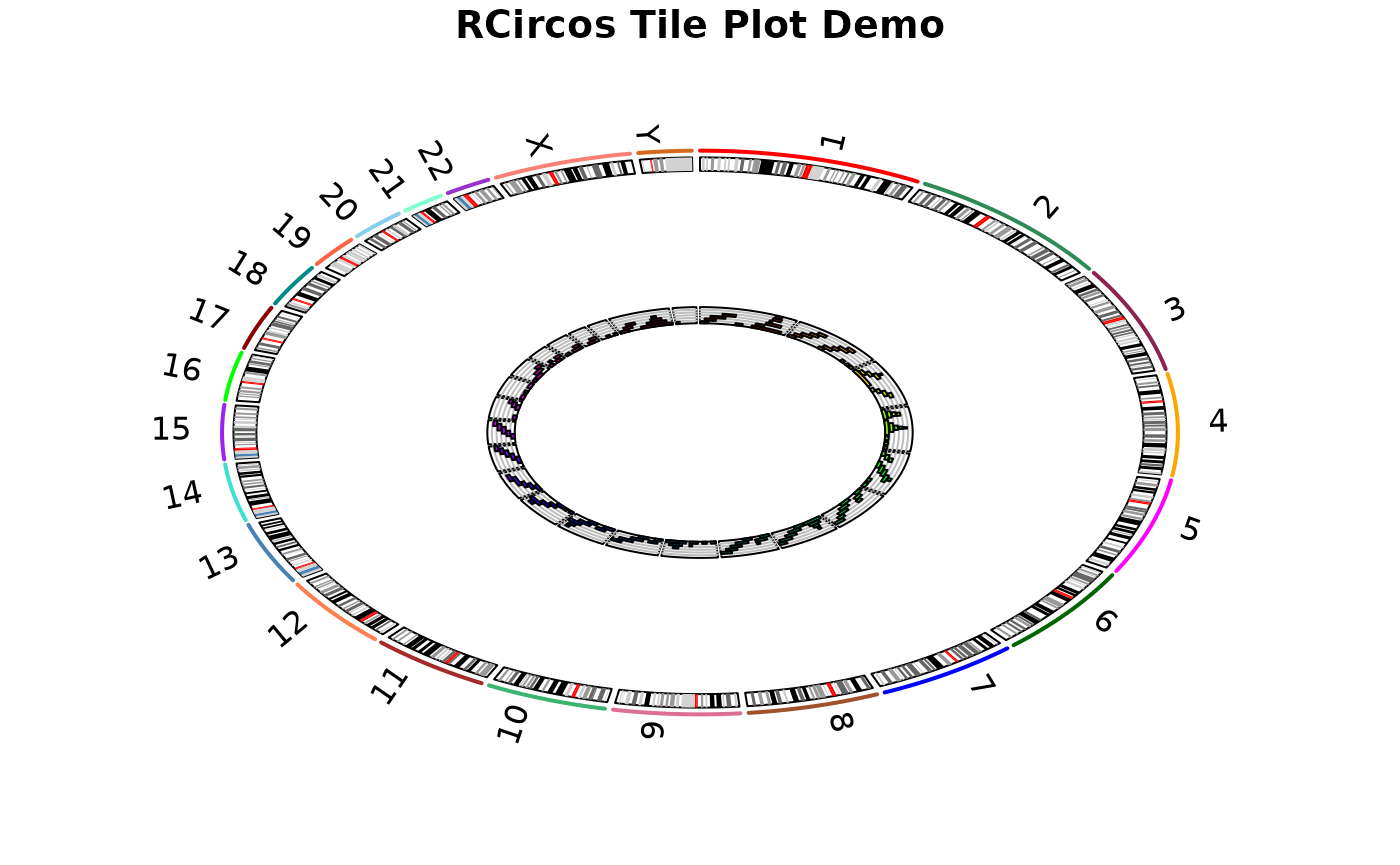
message("RCircos Tile Plot Demo Done!");## RCircos Tile Plot Demo Done!