10 RCircos Ribbon plot
Authors: Hongen Zhang Reviser: Tianze Cao
2025-06-05
Source:vignettes/10 Ribbon_Plot_Demo.Rmd
10 Ribbon_Plot_Demo.RmdThis demo draw ribbon links between chromosomes
# Load RCircos library

library(RCircos);

# Load human cytoband data and link data

data(RCircos.Ribbon.Data); data(UCSC.HG19.Human.CytoBandIdeogram);
cyto.info <- UCSC.HG19.Human.CytoBandIdeogram;

# Setup RCircos core components:

RCircos.Set.Core.Components(cyto.info, NULL, 10, 0);
##
## RCircos.Core.Components initialized.
## Type ?RCircos.Reset.Plot.Parameters to see how to modify the core components.
RCircos.Set.Plot.Area();

# Draw chromosome ideogram

RCircos.Chromosome.Ideogram.Plot();
title("RCircos Ribbon Plot Demo");

# Link lines. Link data has only paired chromosome

# locations in each row and link lines are always

# drawn inside of chromosome ideogram.

ribbon.data <- RCircos.Ribbon.Data;
ribbon.data["PlotColor"] <- c("red", "blue", "green", "cyan");

track.num <- 11;
RCircos.Ribbon.Plot(ribbon.data, track.num, FALSE);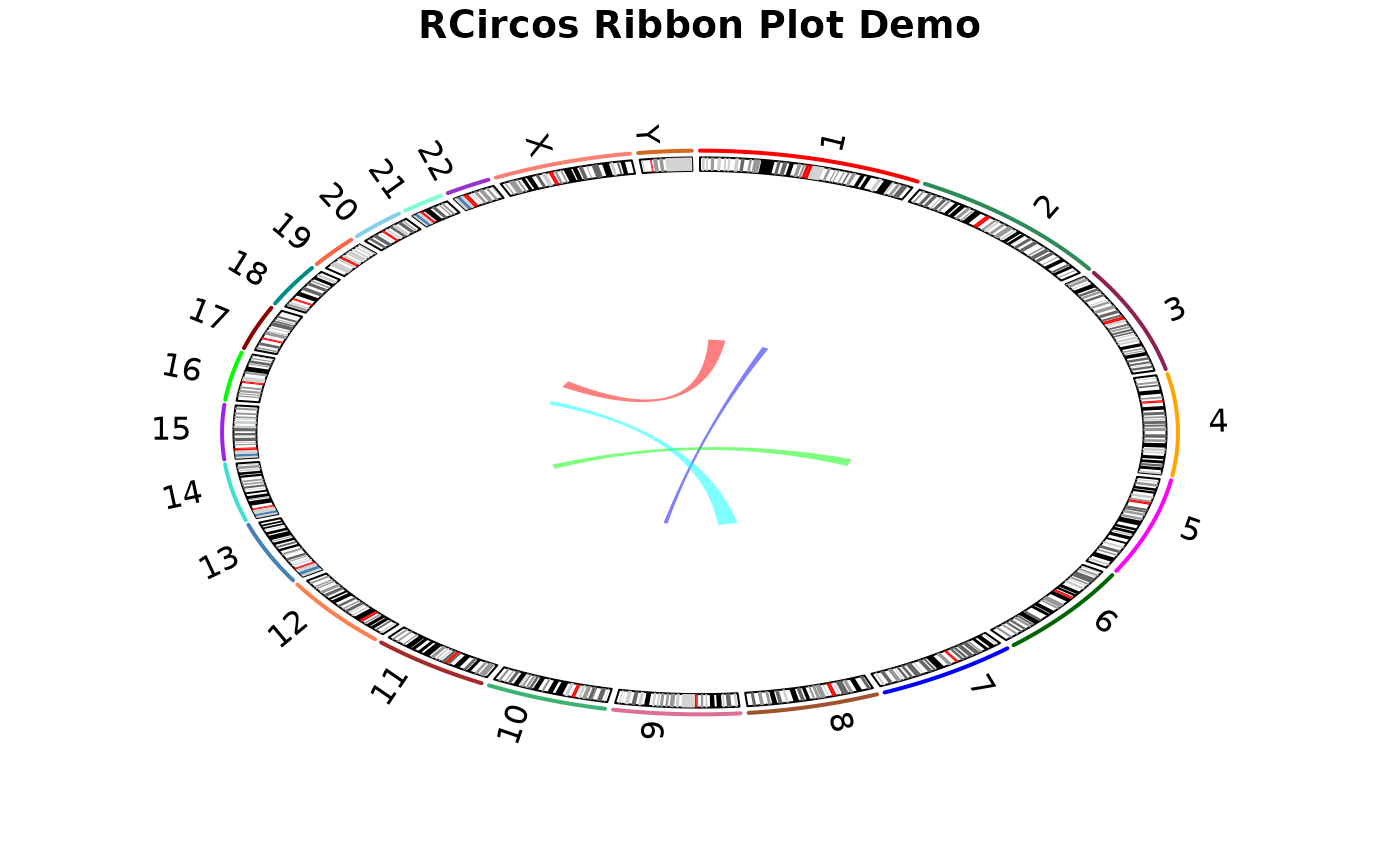
message("RCircos Ribbon Plot Demo Done!"); ## RCircos Ribbon Plot Demo Done!